

Rebuilding LinkedIn’s Tracking Infrastructure: Scaling, Migrating, and Hardening a High-Volume Event Pipeline


By Pravesh Gupta, Senior Staff Software Engineer at LinkedIn & Pranav Mutharia, Senior Software Engineer at LinkedIn
LinkedIn’s tracking infrastructure turns product interactions such as impressions, clicks, page views, and media playback into signals used for experimentation, product analytics, platform health, and product experiences across LinkedIn. The quality and freshness of this data affect how quickly teams can understand product behavior and make informed decisions.
The system processes hundreds of billions of events per day—millions of events per second at peak Member activity—across several hundred event types. At this scale, even a small inefficiency or correctness issue can have a large cumulative impact.
That system had carried LinkedIn’s tracking traffic for years, but the technical environment around it had changed. It ran on Java 8 and the Play Framework while LinkedIn’s service ecosystem standardized on gRPC and a modern Java runtime—and adopting gRPC meant a new request contract and a different serialization path, not a transport-library swap. It also served every event category from one shared capacity pool, so compact engagement events, bursty media events, and deeply nested observability payloads competed for the same resources. Changing the request contract, the serialization path, and the deployment model together is what turned an upgrade into a rebuild.
Rebuilding this system was not simply a REST-to-gRPC migration. We modernized the service architecture and performance, built controls for a safe production migration, strengthened failure handling, data validation, and release safety while traffic continued to flow. This post focuses on how we rebuilt and migrated the pipeline safely, what production traffic revealed about its performance, and how we strengthened correctness and failure handling along the way.
At a high level, the ingestion service is one stage in a broader path. Product interactions are captured and batched by client SDKs, then routed through LinkedIn’s edge and traffic layers. The ingestion service sends latency-sensitive signals directly to real-time processing, while Apache Kafka provides the asynchronous boundary for near-real-time and offline processing.
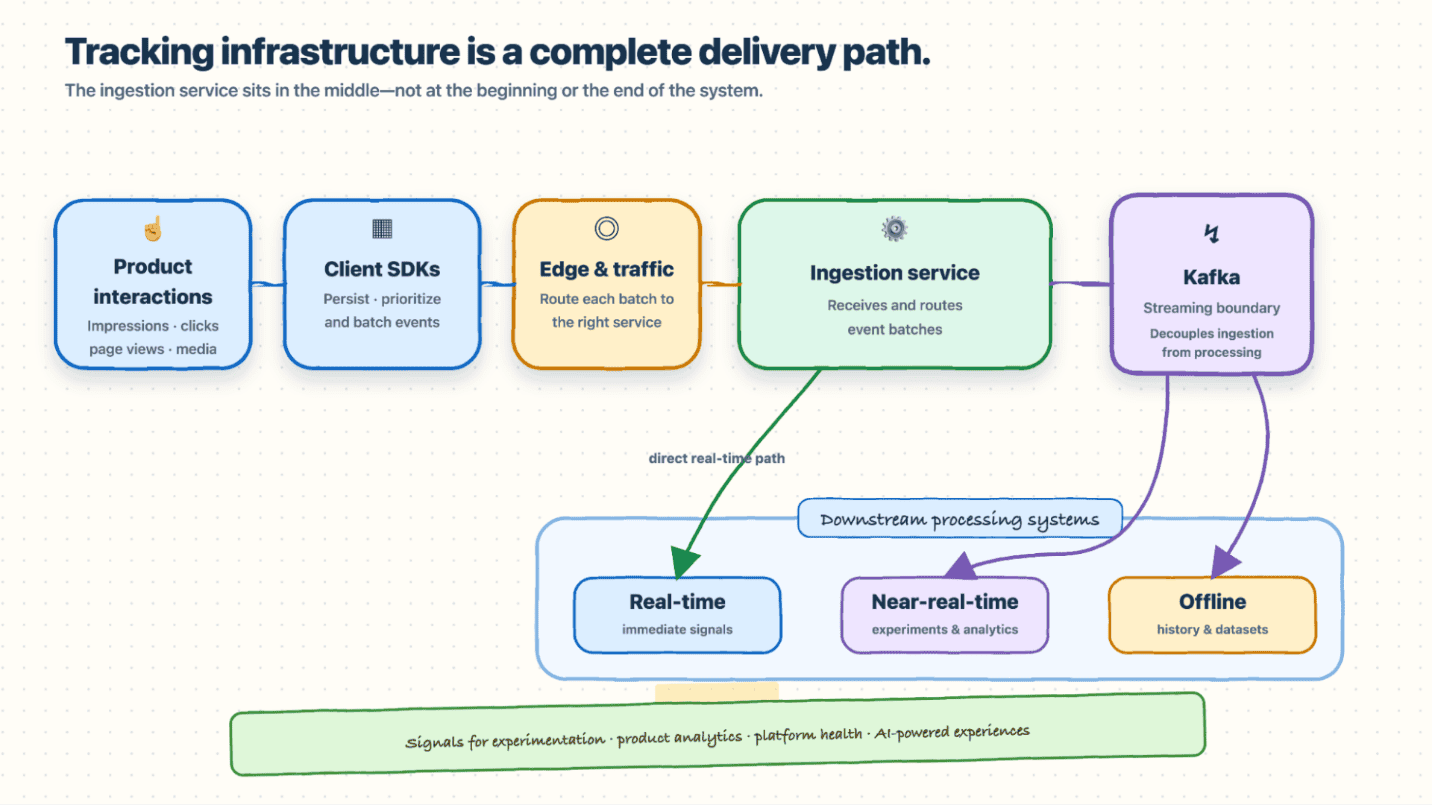 Figure 1. Tracking events move from client SDKs through edge routing and the ingestion service. Latency-sensitive signals follow a direct real-time path, while Kafka supplies near-real-time and offline processing.
The Asynchronous Pipeline Behind the API
Tracking API is an ingestion service within a distributed event pipeline. Mobile and Web SDKs batch interactions, our edge and traffic-routing layers send each batch to the appropriate category-specific Tracking API service, and the service decodes, validates, enriches, classifies, converts, and submits the records through Kafka’s asynchronous producer. Once the Kafka client accepts a record into its local producer buffer, Tracking API returns gRPC success. It does not keep the request open until the Kafka broker replies. A producer callback reports the acknowledgement or failure later, and downstream systems consume acknowledged records independently.
This design prevents Kafka response time from becoming API response time. It also means that success at one boundary does not prove success at the next:
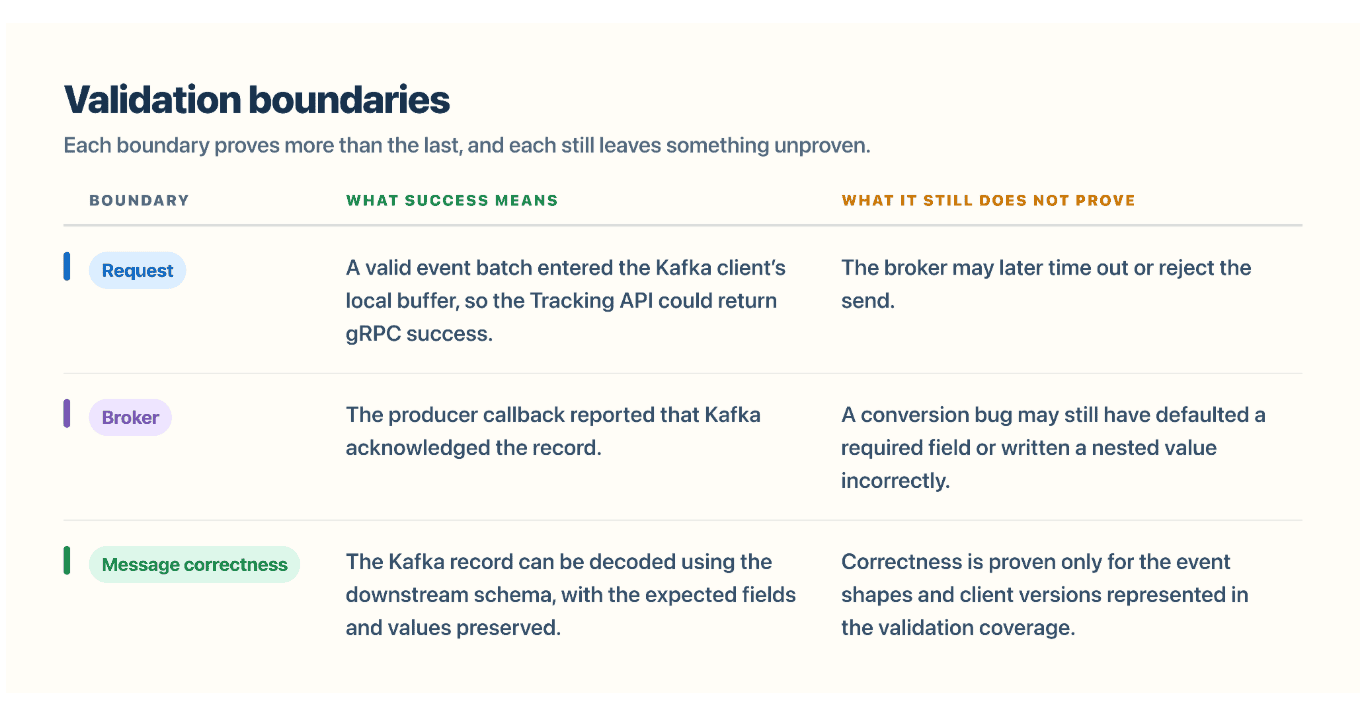 Table 1. The three boundaries the rebuilt service validated independently.
These are not three synchronous checks performed for every production request. Request and callback metrics describe the live path; tagged comparisons and CI/CD tests verify downstream message correctness. Together, they shaped both the migration and the production-hardening work.
Why We Rebuilt Instead of Refactoring
Modernizing the service meant a new request contract, a different serialization path, and a different deployment model. Those changes affected both how requests were processed and how the service was deployed and scaled. Changing them one at a time inside the only production service would have left old and new assumptions mixed together for a long period. We instead built a parallel destination. The legacy path continued serving traffic while we compared outputs, moved one controlled slice at a time, and kept rollback available through routing rather than a new deployment or mobile release.
Takeaway: A parallel rebuild is useful when an in-place migration would create a long and risky intermediate state. It is safe only when the old and new outputs can be compared and traffic can be moved back quickly.
Isolating Workloads by Cost and Failure Risk
The rebuilt service separated traffic into broad workload categories. Each category received independently scalable hardware, deployment controls, and operational metrics.
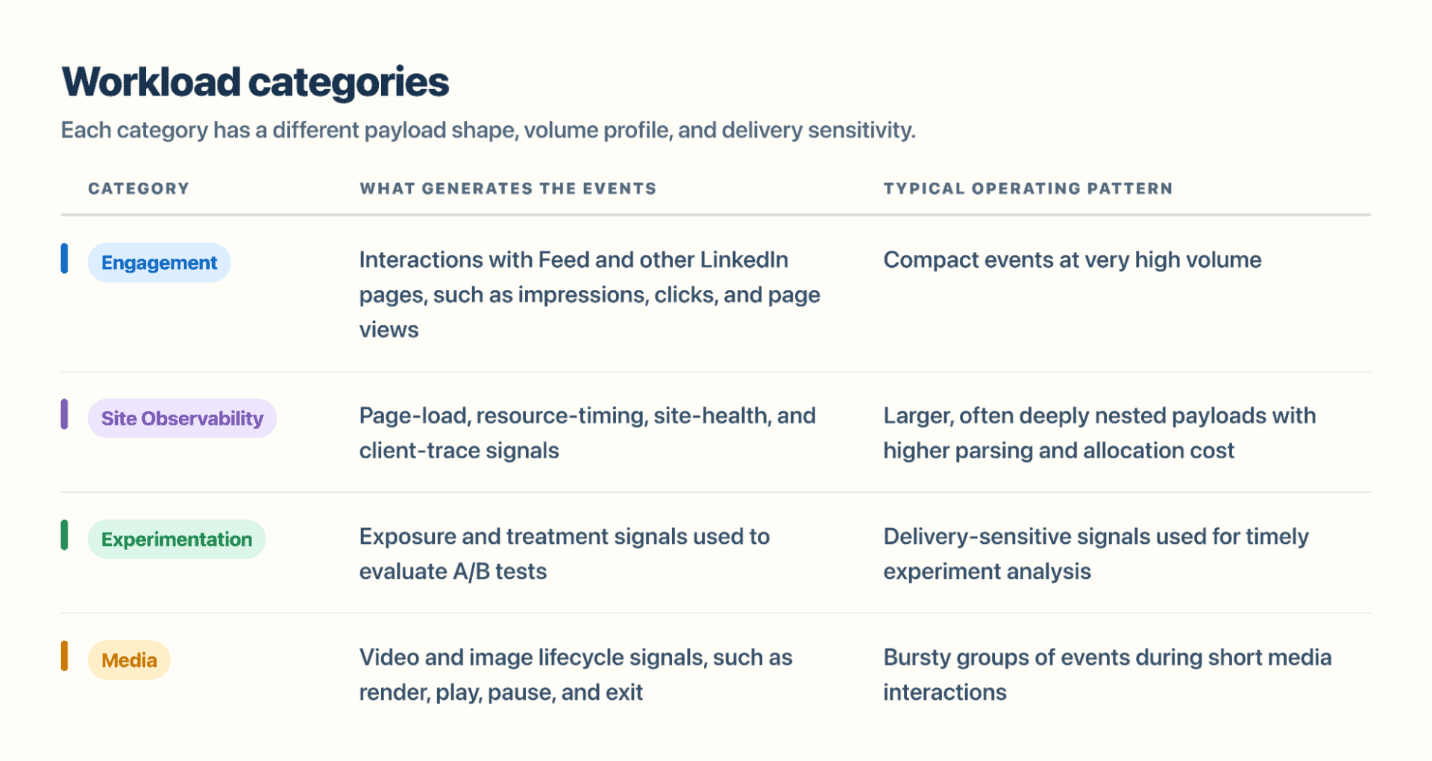 Table 2. Traffic shape and delivery sensitivity drove how categories were isolated.
This was not merely code organization. Isolation changed how the system behaved:
-
Capacity: when a member scrolls through a media-rich Feed, render, play, pause, and exit events arrive close together; that burst can no longer consume capacity reserved for experimentation traffic, and a deeply nested observability workload can be provisioned for its higher CPU and allocation cost.
-
Measurement: performance numbers no longer average unlike workloads together.
-
Blast radius: categories can move through migration at different speeds, and failures or rollback stay contained to one platform and category.
Compression can reduce the wire size of a nested observability event, but the service must still traverse its collections, validate its values, allocate intermediate objects, and convert the complete structure. Separate capacity allowed that heavier work to be tuned without forcing every event category into the same resource model.
Reducing Repeated Context on the Wire
Each event contains unique data, but many events in the same request share the same client and session context. The legacy contract repeated much of this context for every event. A few hundred repeated bytes appear small until clients send millions of events per second. Clients serialize the same fields repeatedly, the network carries them repeatedly, and the server parses them repeatedly.
The new contract sends shared context once and reuses it across events where the client path allows it. In the observed production windows, the average aggregate inbound network receive metric decreased from 210.7G on the legacy service to 21.7G on the rebuilt service, a reduction of approximately 89.7%, or about 9.7x. The rebuilt service carried 90% of production traffic during that window; adjusting to full traffic puts the reduction near 89%, or close to 9x. The improvement reflects the combined effect of shared-context reuse, Protocol Buffers, and related serialization changes.
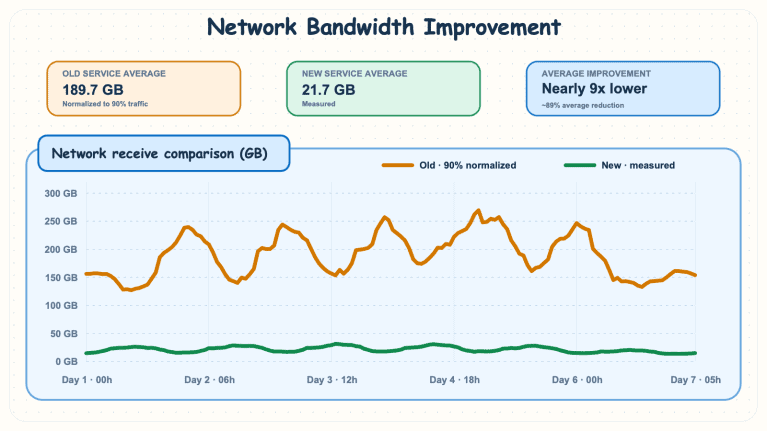 Figure 2. Aggregate inbound network usage across representative pre- and post-migration windows. Chart values are measured aggregates; the rebuilt service carried 90% of production traffic in that window. Adjusted for full traffic, inbound network usage was approximately 89% lower.
Moving Production Traffic with Evidence
Building the new service created a destination. Migration controls made it safe to use. Server-controlled feature flags routed traffic independently by platform and workload category. Each slice could move through small percentages, remain in comparison mode, or return to the legacy path within minutes.
Comparing a tagged 10% sample
Before moving a traffic slice, we sent 10% of eligible events through both pipelines and compared the records they produced. Each sampled event carried a comparison identifier. That identifier let us filter the same events from the legacy output and match them with records from the rebuilt output. During comparison, the legacy pipeline continued writing sampled events to the production Kafka topic, while the rebuilt pipeline wrote its copies to a dedicated shadow topic. Comparison jobs matched records across the two topics using the identifier, while normal downstream processing did not consume the shadow copies, a design intended to keep duplicate events out of production datasets.
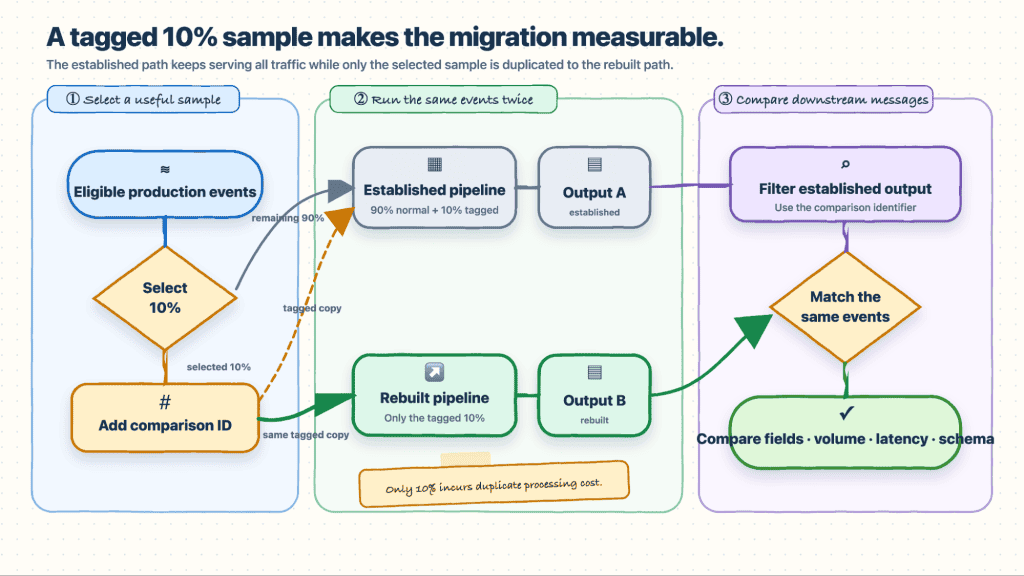 Figure 3. A tagged 10% sample flowed through both the legacy and rebuilt pipelines. The legacy path continued writing to the production Kafka topic, while the rebuilt path wrote to a shadow topic. Comparison identifiers allowed matching, and the shadow topic was designed to keep comparison copies out of normal production processing.
We deliberately avoided dual-firing 100% of traffic. Full duplication simplifies matching, but it also doubles ingestion work and creates unnecessary downstream data, storage, and compute costs. At LinkedIn’s scale, that is a significant price for validation. The sample carried real product-instrumented values across the SDK versions in use. It therefore covered uncommon value combinations and legacy conventions that unit-test fixtures might not represent. Validation included:
-
field-level output compatibility;
-
matching event volumes;
-
end-to-end event latency;
-
downstream schema compatibility; and
-
operational metrics split by platform and category.
Any unexplained difference blocked that slice from advancing. Within the scopes we validated, the comparison did not leave unresolved migration-caused differences at ramp time.
Starting with high-volume events
After the comparison process and rollback path were proven, we migrated to a small set of high-volume events first. This was more informative than beginning only with low-volume traffic:
-
small mismatches in event volume or shifts in end-to-end event latency became measurable sooner;
-
concurrency, queues, and capacity limits were exercised early;
-
rare defects appeared more frequently; and
-
Each successful move removed a meaningful share of load from the legacy service.
We still controlled risk through staged percentages, independent routing, automated monitoring, and immediate rollback. The strategy was not to move critical traffic and hope; it was to build enough evidence and reversibility that the most informative traffic could test the system.
Takeaway: A tagged, representative sample can provide strong migration evidence without the cost of duplicating everything. Once comparison and rollback work reliably, high-volume traffic can reveal correctness and capacity problems faster.
Profiling the Real Workload
The ingestion path performed little blocking application-side I/O. After validation and enrichment, events were handed to the asynchronous Kafka producer. At high throughput, CPU—not waiting for remote calls—was the main constraint.
Initial profiling showed that most CPU time accumulated in message production, serialization, compression, and object conversion. We then followed a simple sequence: move the proven business logic without changing its behavior, confirm matching output and latency, profile under production-like concurrent traffic, change one dominant cost at a time, and prove output compatibility again.
Serialization and compression
The migrated path initially converted each protocol-buffer event into an intermediate Apache Avro object before writing the downstream binary record. We replaced that step with a precompiled inline encoder for both low-latency and high-throughput producers, avoiding generic records, nested maps, and other temporary objects while preserving the same Avro binary output. In a warmed local benchmark with four concurrent clients and ten events per request, inline encoding increased throughput by 12%, reduced allocation per request by 3.4%, and reduced objects surviving into the long-lived heap by 95%, with no material change in median or 95th-percentile latency.
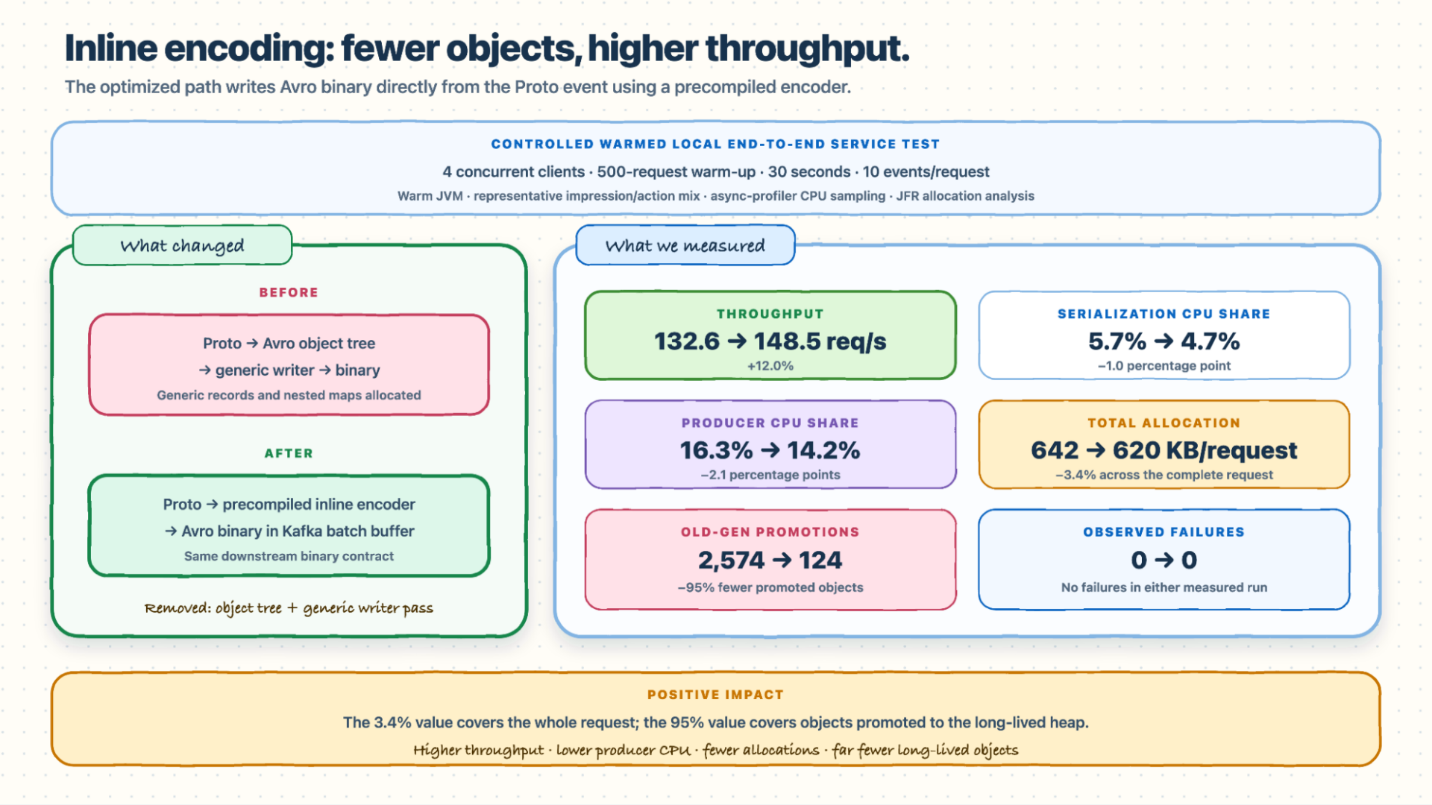
Figure 4. Inline encoding removes the intermediate Avro object tree and generic-writer pass while preserving the same downstream binary record. In the controlled local test, the change increased throughput, reduced producer and serialization CPU, lowered total allocation, and reduced objects promoted to the long-lived heap by 95%.
The legacy producer also used gzip, whose Java compression path consumed substantial CPU. We switched Kafka batch compression to zstd, which uses a faster native implementation while maintaining a similar compression ratio for our event payloads; brokers already support zstd and downstream clients detect the codec from batch metadata, so the change did not require a new downstream message contract. In the same style of isolated local benchmark, zstd increased throughput by 13.7%, reduced median and 95th-percentile latency by about 5%, left 99th-percentile latency roughly unchanged, and reduced the Kafka producer’s share of active CPU samples by three percentage points.
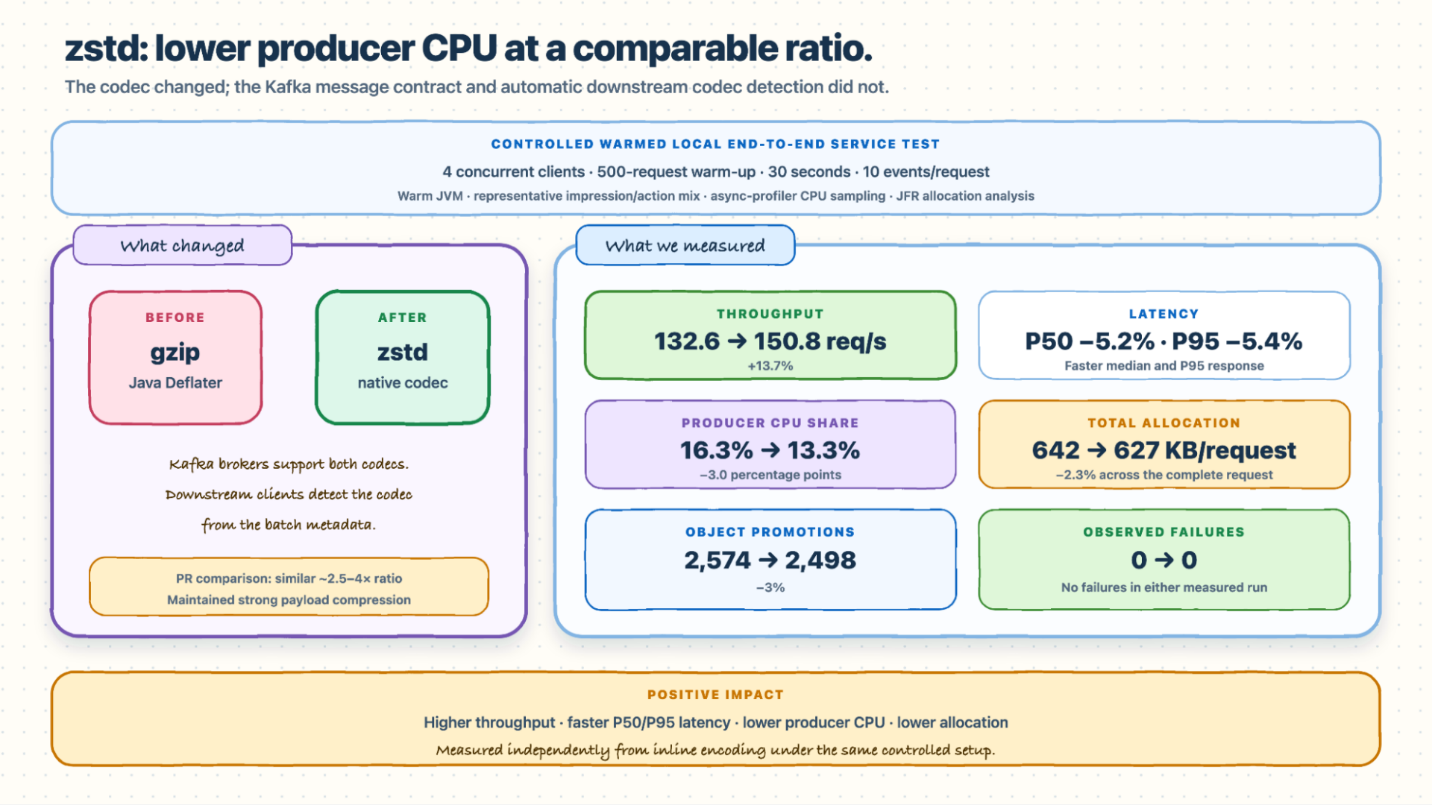 Figure 5. Switching Kafka batch compression from gzip to zstd improved throughput and median and 95th-percentile latency while reducing Kafka-producer CPU and total allocation. The tested payloads retained a compression ratio comparable to gzip, and the downstream message contract remained unchanged.
We measured the two changes independently because they optimize different parts of the Kafka production path — inline encoding reduced serialization and allocation work, zstd reduced compression cost — so their throughput gains should not be added together. The combined configuration produced the lowest Kafka-producer CPU we observed locally, but it did not reproduce the sum of the two isolated gains. We treated all of these as directional signals rather than production-capacity claims, and validated both changes through byte-for-byte compatibility checks and staged production rollout. The tradeoff also generalizes: a storage-bound system may prioritize the smallest output, while a CPU-bound ingestion service may benefit more from a codec that preserves a similar ratio while completing the compression work much faster. We monitored both producer CPU and downstream storage before expanding the change.
Finding a concurrency problem that benchmarks missed
As more high-volume traffic moved, profiling showed that conversion had again become a major CPU cost. A schema comparison deep in the path repeatedly accessed a shared cache. It looked inexpensive in a sequential benchmark, but under concurrent traffic many workers competed for the same resource. We replaced repeated field-level comparisons with a direct conversion path for supported events while keeping the legacy conversion as a fallback. Stress tests, mirrored traffic, and byte-for-byte output checks showed that the change reduced CPU and memory pressure without changing downstream Kafka records.
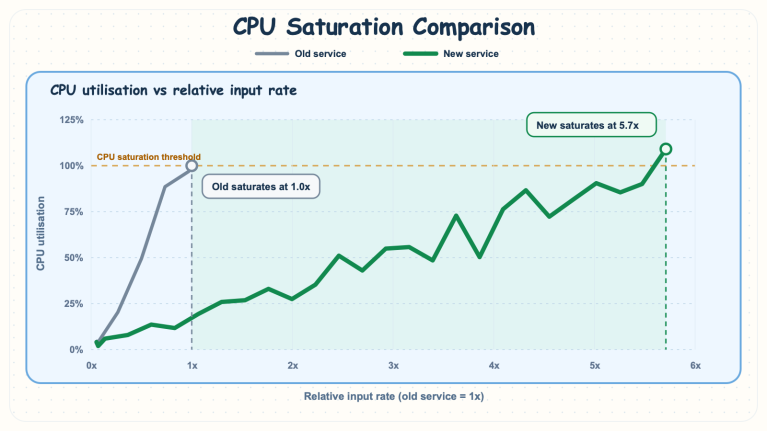 Figure 6. Production-shaped stress tests for the rebuilt service. The rebuilt service sustained a materially higher input rate than the legacy service before reaching the CPU-utilization threshold, providing early evidence of improved compute efficiency under concurrent load.
Takeaway: Optimize the real bottleneck, not a generic benchmark. Sequential tests can hide threads competing for shared resources, so profile under realistic concurrency and protect every optimization with output checks.
Turning Delayed Kafka Failures into Backpressure
Matching output under healthy traffic was necessary but not sufficient. The rebuilt service also had to fail safely under Kafka slowdowns and recover without losing events unnecessarily.
The Kafka producer runs asynchronously for throughput, so broker and network failures can arrive in callbacks after the caller has received success. Previously, callbacks updated metrics but did not affect request admission. During slowdowns, the service continued decoding and transforming events while retries and buffered records accumulated. The finite producer buffer became the last defense against event loss—after CPU and memory had already been spent.
We connected callback outcomes to request admission through an overload detector. It tracks a short rolling window and counts failures that reduced traffic can relieve: buffer exhaustion, broker or network unavailability, timeouts, disconnects, and enqueue failures. Record-specific and configuration errors, such as oversized records, missing topics, authorization failures, or malformed payloads, do not count; shedding unrelated traffic cannot fix them.
When failures exceed the configured threshold, the host rejects requests before processing, giving its Kafka buffer time to drain. Rejection preserves an opportunity for the load balancer—and subsequently the client—to retry on a healthy host, unlike failures discovered after success has been returned. Recovery requires positive evidence. Rejected traffic produces fewer callbacks, so silence does not prove recovery; enough healthy callbacks must arrive before admission resumes.
We first deployed in monitor-only mode. During a subsequent broker degradation, the detector signaled overload before callback failures and buffer pressure peaked, supporting the decision to enable enforcement.
Takeaway: In an asynchronous producer path, delayed failures must influence which requests are accepted next. Reduce load only for failures that less traffic can relieve, reject before expensive processing, and require healthy evidence before reopening.
Impact and Lessons
The rebuilt service now handles migrated traffic with more granular scaling and failure boundaries. Workload isolation, lower inbound network usage, and reduced Kafka-producer CPU and allocation all contribute to a more efficient operating model. We avoid comparing raw fleet sizes because the legacy and rebuilt systems use different runtimes, host profiles, and workload boundaries. Reusing request context reduced repeated network data, while continuous profiling improved CPU, memory, and throughput as real workloads moved.
The rebuilt path reached 90% of total production traffic with no migration-attributed production incidents identified to date. This outcome was supported by continuous delivery monitoring and by repeatedly validating payload correctness, capacity, and dependency behavior throughout the staged rollout.
The broader lessons extend beyond tracking:
-
Make structural migrations reversible. Run old and new paths together, move independently controlled slices, and keep rollback separate from deployment.
-
Compare what downstream systems receive. API success is only one point in an asynchronous pipeline.
-
Use representative samples rather than duplicating everything. Tagging enables precise comparison at lower operational cost.
-
Isolate workloads by cost and failure impact. Logical similarity does not imply identical capacity needs.
-
Measure the envelope, not only the payload. At high volume, context repeated on every event can cost more than the unique event data itself.
-
Profile under realistic concurrency. Sequential benchmarks can hide contention and allocation costs.
-
Connect delayed failures to future admission. Callback telemetry should influence whether a host accepts more work.